
Article
Observability in Modern Software Systems: From Tools to Intelligence
This blog explains why traditional monitoring fails in distributed systems; where systems appear operational while business outcomes silently fail and why observability has become a strategic necessity rather than an engineering preference. It covers the three pillars (logs, metrics, and traces), the critical role of correlation through context propagation, unique risks in marketing and RevOps stacks, and a maturity framework that transforms observability from reactive tooling into proactive, revenue-enabling infrastructure.
- Topic
- Technology
- Published
- 18 Jun 2026

The Strategic Shift Happening Now
Modern marketing and software organizations no longer run tools. They operate distributed systems. Customer data flows through CDPs, CRMs, enrichment platforms, AI scoring models, and real-time orchestration engines that constantly interact, retry, and cascade into one another. A server can be running. An API can return a healthy status code. A dashboard can show green. And yet, customers experience broken personalization, misrouted leads, or slow checkouts. The system appears operational while the business outcome is silently failing.
According to industry analysis, roughly 50% of enterprises report application performance issues missed by monitoring but first caught by customers. This gap between "the system is running" and "the system is working" is where observability becomes a strategic necessity, not an engineering preference. The transition happening now is not just technical. It is a fundamental shift from reactive tool management to proactive system intelligence.
Monitoring vs. Observability: A Critical Distinction
Monitoring answers a single question: is the system behaving within predefined thresholds? It works well for known failure modes. Set an alert for CPU usage above 80%. Define a threshold for error rate. When those limits are crossed, an alert fires and a team responds.
But modern distributed systems fail in ways teams cannot predict in advance. An AI recommendation engine begins favoring a narrow product segment due to a subtle data skew. A third-party tag introduces latency, but only for users on specific mobile carriers. An attribution model credits the wrong channels because a cookie consent change altered data collection patterns upstream.
These are unknown failure modes. No individual component breaks. The interactions between components create the failure. And monitoring, which can only detect anticipated problems, misses all of it.
Observability inverts the approach. Instead of asking whether a metric crossed a threshold, it asks: given this complex system behavior, what explains it? This requires fundamentally different instrumentation. Not just counters and gauges, but rich contextual signals that preserve causal relationships between events across service boundaries.
A 2025 SolarWinds report found that organizations with mature observability practices achieve 56% faster mean time to repair compared to those relying on monitoring alone. The business case is direct: faster diagnosis means less revenue lost, fewer customer-impacting failures, and shorter recovery windows.
The Three Signals and Why Correlation Is the Real Capability
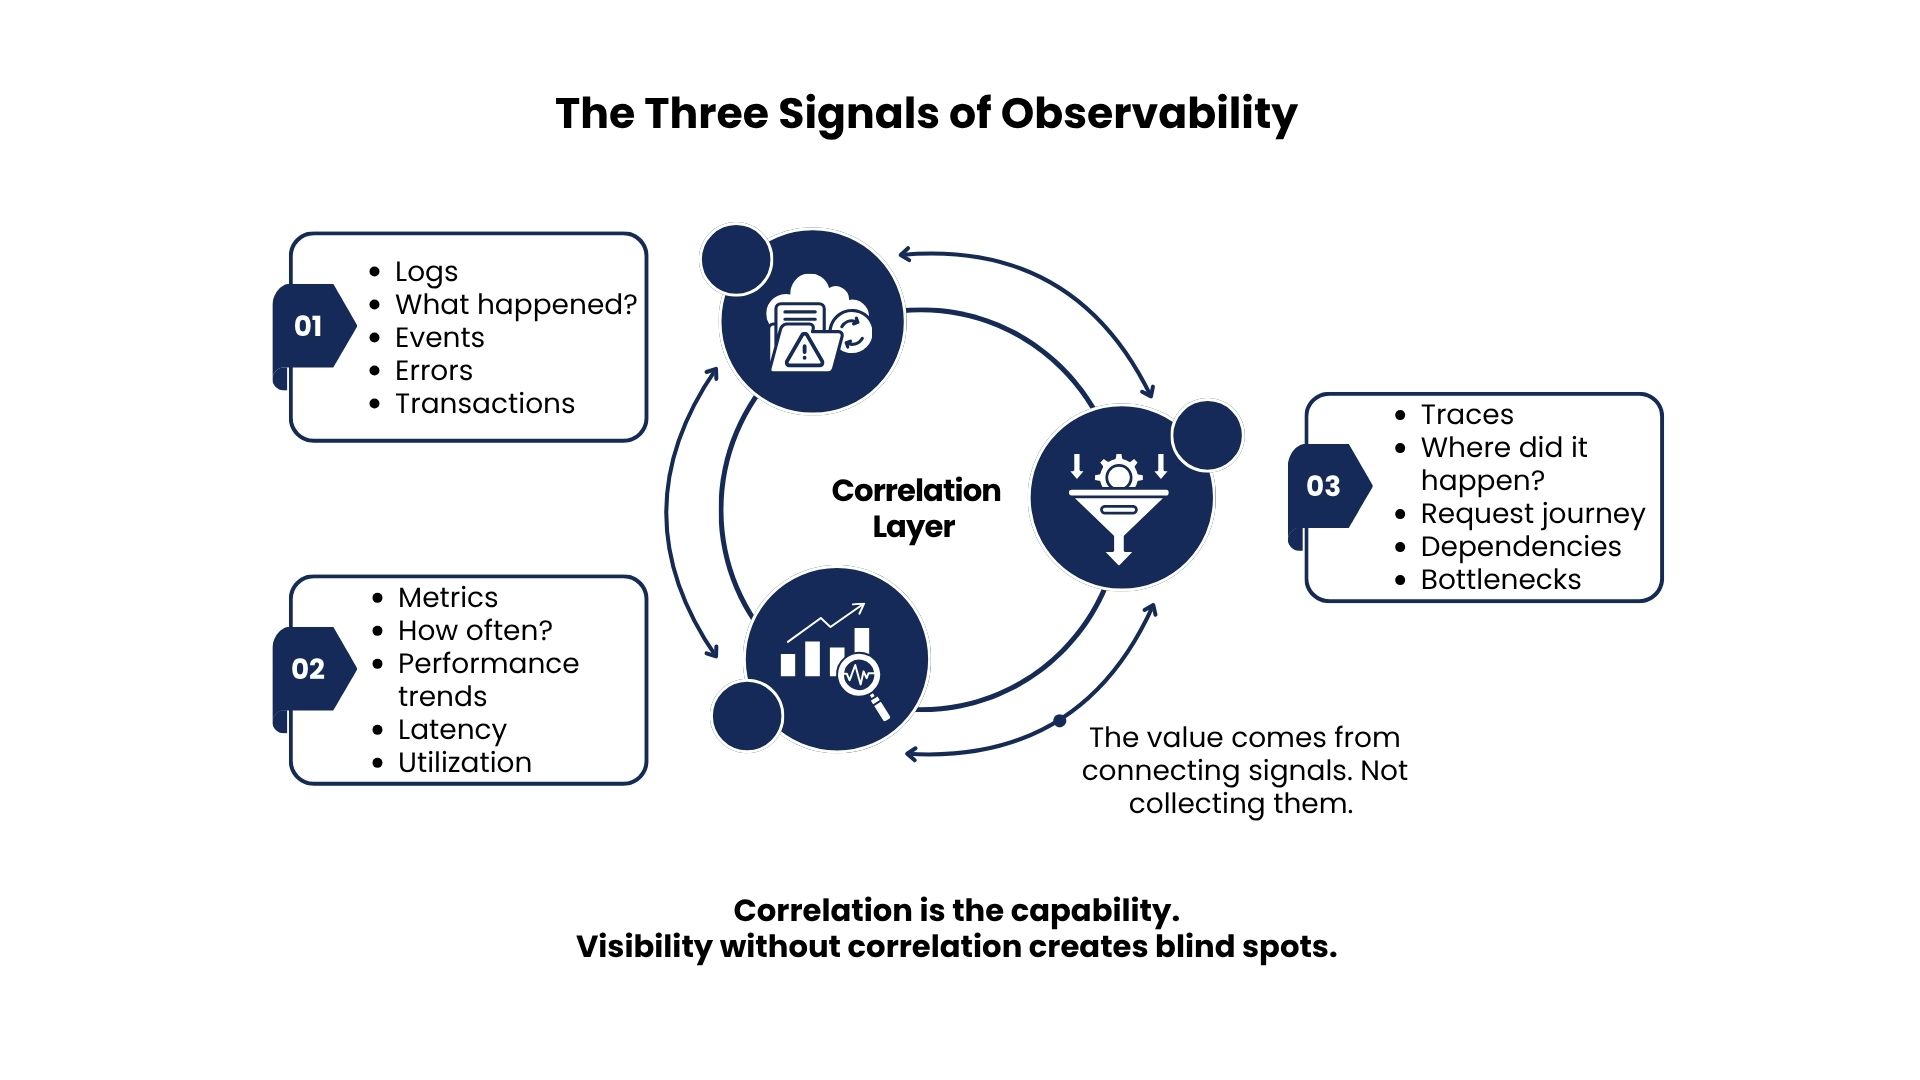
Effective observability rests on three interconnected data types, each capturing a different dimension of system behavior.
Logs are timestamped records of discrete events. They capture what happened, when, and in which service. Structured logs that carry correlation IDs and contextual metadata are exponentially more useful than unstructured text. A 2025 RevOps benchmark found that organizations with consistent log schemas reduced mean time to diagnose incidents by 41%.
Metrics are numeric measurements aggregated over time. They show trends, detect anomalies, and surface whether system behavior is drifting outside expected ranges. However, metrics describe symptoms. A latency spike tells you something is wrong. It cannot tell you which service caused the delay or why it happened under a specific traffic pattern.
Traces capture the complete lifecycle of a single request as it travels across services. When a user action touches an API gateway, three microservices, two databases, and a message queue, a trace reconstructs the entire journey. It shows latency at each hop, failed downstream calls, and the contextual data that traveled with the request. A 2025 RevOps case found that implementing distributed tracing reduced mean time to resolution for system incidents by 52%.
The force multiplier is correlation, not collection. A trace provides the request ID for a failed transaction. That same ID appears in the logs of every service the request touched, and in the metrics for each of those services. An engineer can jump from a single slow request to its exact root cause across the entire stack without switching tools or guessing.
This requires consistent context propagation. Every service must accept and forward correlation identifiers. Without this, traces break at service boundaries, and root cause analysis reverts to manual log-checking across disconnected systems.
Why Marketing and RevOps Systems Face a Unique Risk
Marketing infrastructure has quietly become one of the most complex distributed systems in the enterprise. AI models drive audience segmentation, lead scoring, and real-time personalization. Data flows between CRMs, CDPs, enrichment providers, and sequencing engines in near-real time. A single campaign motion may touch a dozen services before a lead is routed or an email is triggered.
A 2025 RevOps benchmark of AI-driven GTM stacks found that only 34% of marketing leaders could confidently explain how a pipeline-related system failure propagated through their stack. A 2024 RevOps case study showed that 73% of GTM-impacting incidents were not captured by existing alerts because they involved multi-service cascades. A small latency spike in an enrichment service caused a sequencing engine to retry, which triggered an API rate limit, which caused some leads to never be routed. The alerting system reported normal behavior. The business saw a 20% pipeline gap.
The consequences of poor observability in marketing systems are not just technical. They are revenue consequences. A slow personalization engine reduces conversion. A hidden integration failure breaks campaign activation. An unmonitored AI model drifts and degrades targeting quality without triggering a single alert.
Organizations that instrument their marketing systems for observability do not just recover faster. They build a corpus of execution data that can train better AI models, quantify the business impact of technical decisions, and identify optimization opportunities invisible in aggregate metrics.
A Framework for Observability Maturity
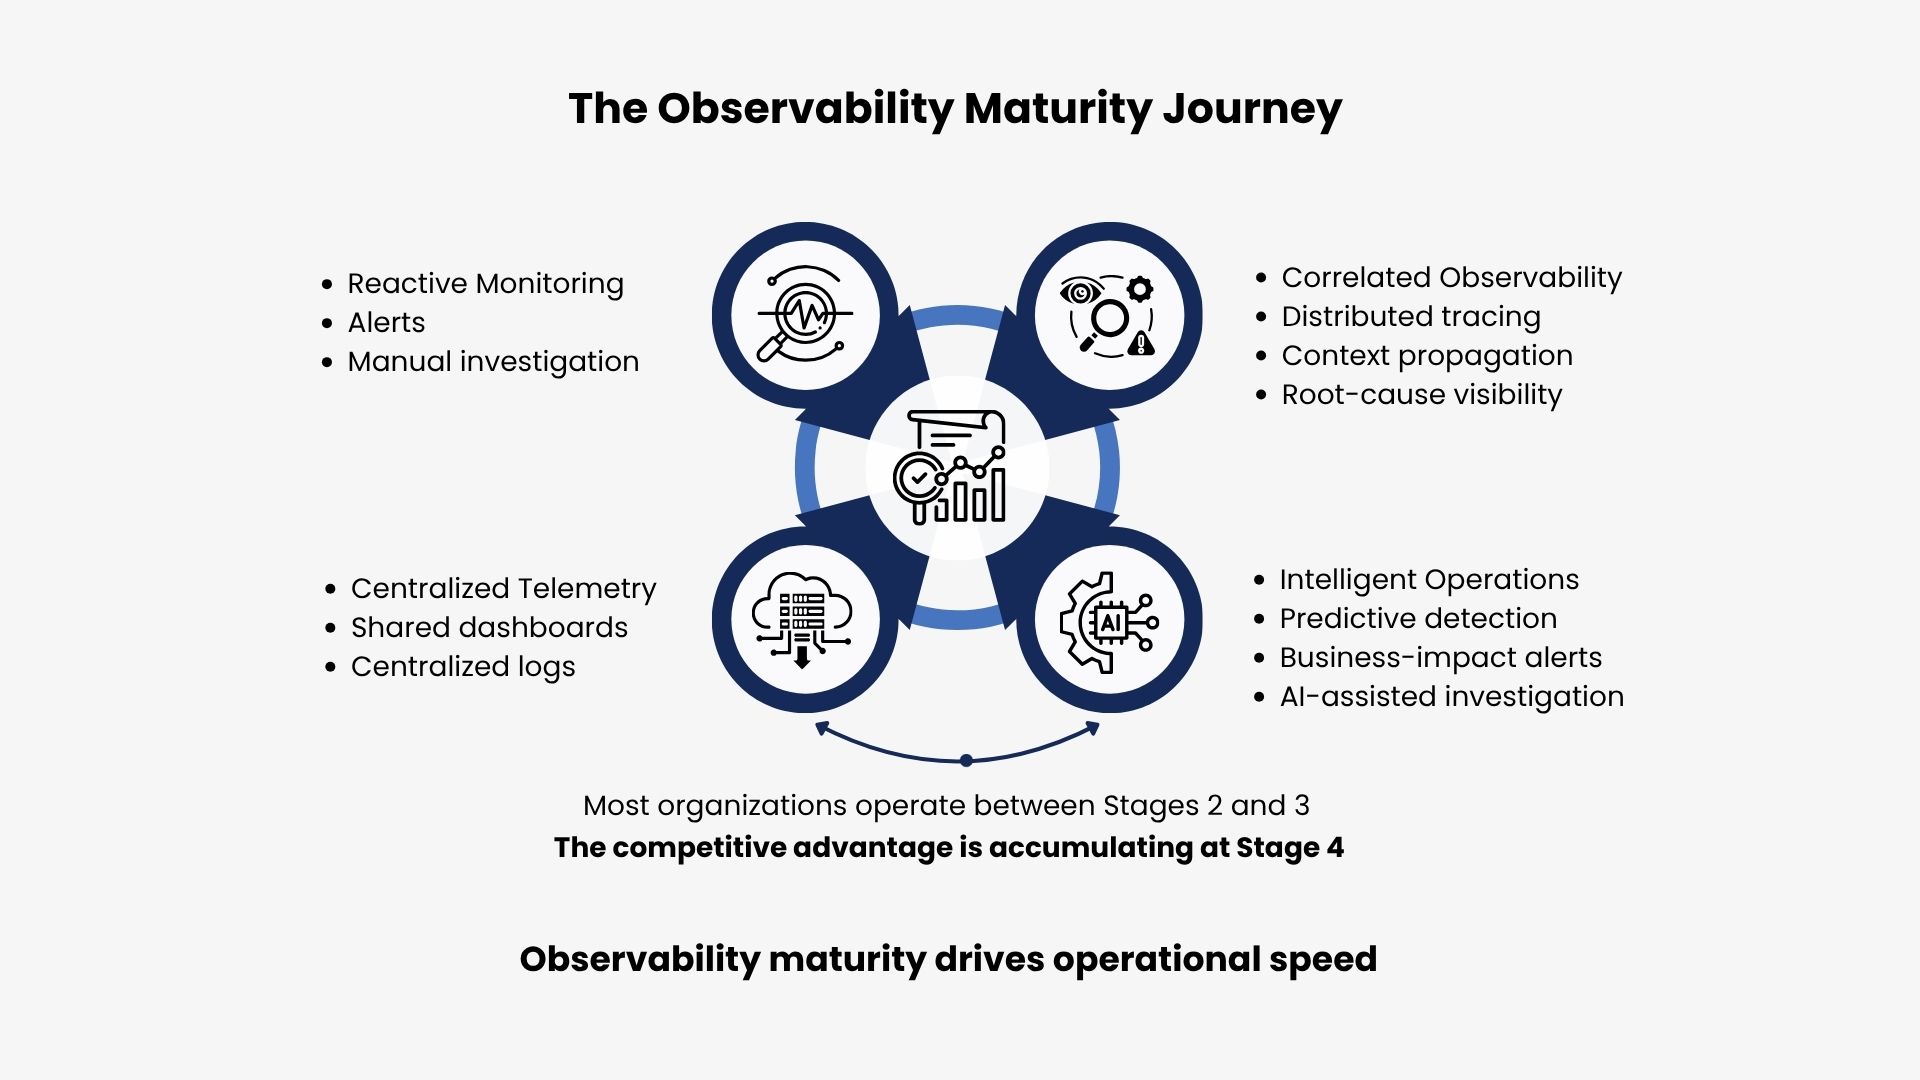
Most organizations exist somewhere on a maturity curve that spans four stages.
Stage one is reactive monitoring. Teams have basic uptime checks, infrastructure metrics, and manual log review. Obvious failures are detected, but complex incidents are missed and slow to diagnose.
Stage two is centralized telemetry. Logs, metrics, and traces are collected centrally. Dashboards are searchable. Basic alerting rules exist. Visibility improves, but correlation across services remains weak and inconsistent.
Stage three is correlated observability. Distributed tracing is in place. Context propagates through the stack. Teams can reconstruct the full lifecycle of a request or a lead from ingestion to final outcome. Root cause analysis is faster and more precise.
Stage four is intelligent operations. Anomaly detection automates pattern recognition. Alerts are based on business impact rather than raw thresholds. AI-assisted investigation and predictive alerting begin to surface failures before customers notice them.
Most organizations currently operate between stages two and three. They have correlation IDs and basic tracing but struggle with coverage gaps and cost management. The competitive advantage is accumulating at stage four.
Strategic Implications: Observability as a Revenue-Enabling Capability
The real value of observability compounds over time. In the short term, it reduces the cost of incidents through faster diagnosis and fewer escalations. Over time, the returns are more significant.
Observable systems generate a history of system behavior that becomes the foundation for continuous improvement. Teams can A/B test infrastructure changes with the same rigor applied to creative. Engineers can instrument AI models to detect drift before it affects business outcomes. Organizations can quantify what revenue uplift came from reducing personalization latency, or what pipeline was recovered by closing a specific integration gap. This shifts technology from a cost center to a strategic asset. Organizations with mature observability move faster, adopt new technologies more aggressively, and experiment more boldly because they can isolate the impact of any change.
But tooling alone does not create this advantage. Observability requires a cultural commitment. Developers must instrument features, not just deploy them. Data scientists must treat their models as debuggable systems. RevOps and engineering teams must share ownership of system health rather than escalating across functional silos. Alert design must evolve from threshold noise to contextual signals tied to business outcomes. Every incident is a learning opportunity: the right post-incident question is not who made a mistake, but what instrumentation gap allowed the problem to go undetected.
Conclusion: The Foundation for Scalable Intelligence
Modern software systems are too distributed, dynamic, and interconnected for traditional monitoring to manage effectively. Metrics can show that something changed. Logs can show what happened. Traces can show where it happened. Context propagation connects these signals into a coherent system view.
As marketing infrastructure grows more AI-driven, more real-time, and more dependent on distributed services, the organizations that treat observability as architecture will outpace those that treat it as a dashboard layer. They will recover faster, build more reliable systems, and create stronger customer experiences at scale.
The question is not whether your organization can afford to build observability into its systems. The question is whether you can afford to debug your next significant failure without it.