
Article
Data Quality Challenges in Large-Scale Analytics Systems
This blog examines how systematic data quality failures can cost organizations millions in lost revenue and operational inefficiencies. It outlines a "shift-left" technical framework for implementing automated validation, anomaly detection, and clear accountability to transform reliable data into a competitive advantage.
- Topic
- Data Engineering and Analytics
- Published
- 18 Mar 2026

Your executive team is thrilled because the dashboard shows 25% revenue growth. However, three weeks later, finance finds out that a data entry error has led to the customer records being corrupted over six months of transactions. The real figure? 8% growth.
This is a scenario that repeats itself daily in B2B companies. 64% of organizations say that the quality of their data is the biggest danger to the integrity of their data, while 67% confess that they don't fully trust their data for making decisions, according to Precisely's 2025 Data Integrity Trends Report. Gartner has estimated that poor data quality is responsible for operational inefficiencies and wrong decision-making, which, in turn, makes organizations lose between $9.7 million and $15 million annually.
For demand generation leaders and CMOs who are on the analytics-driven strategy bandwagon, poor data quality is more than just a technical bother. Every dollar that goes down the drain due to targeting errors, every lost opportunity that results from analyzing corrupted data, and every compliance failure that stems from incomplete records equate to money that could have been used for growth but was not invested.
Factors Contributing to Data Quality Degradation at Scale
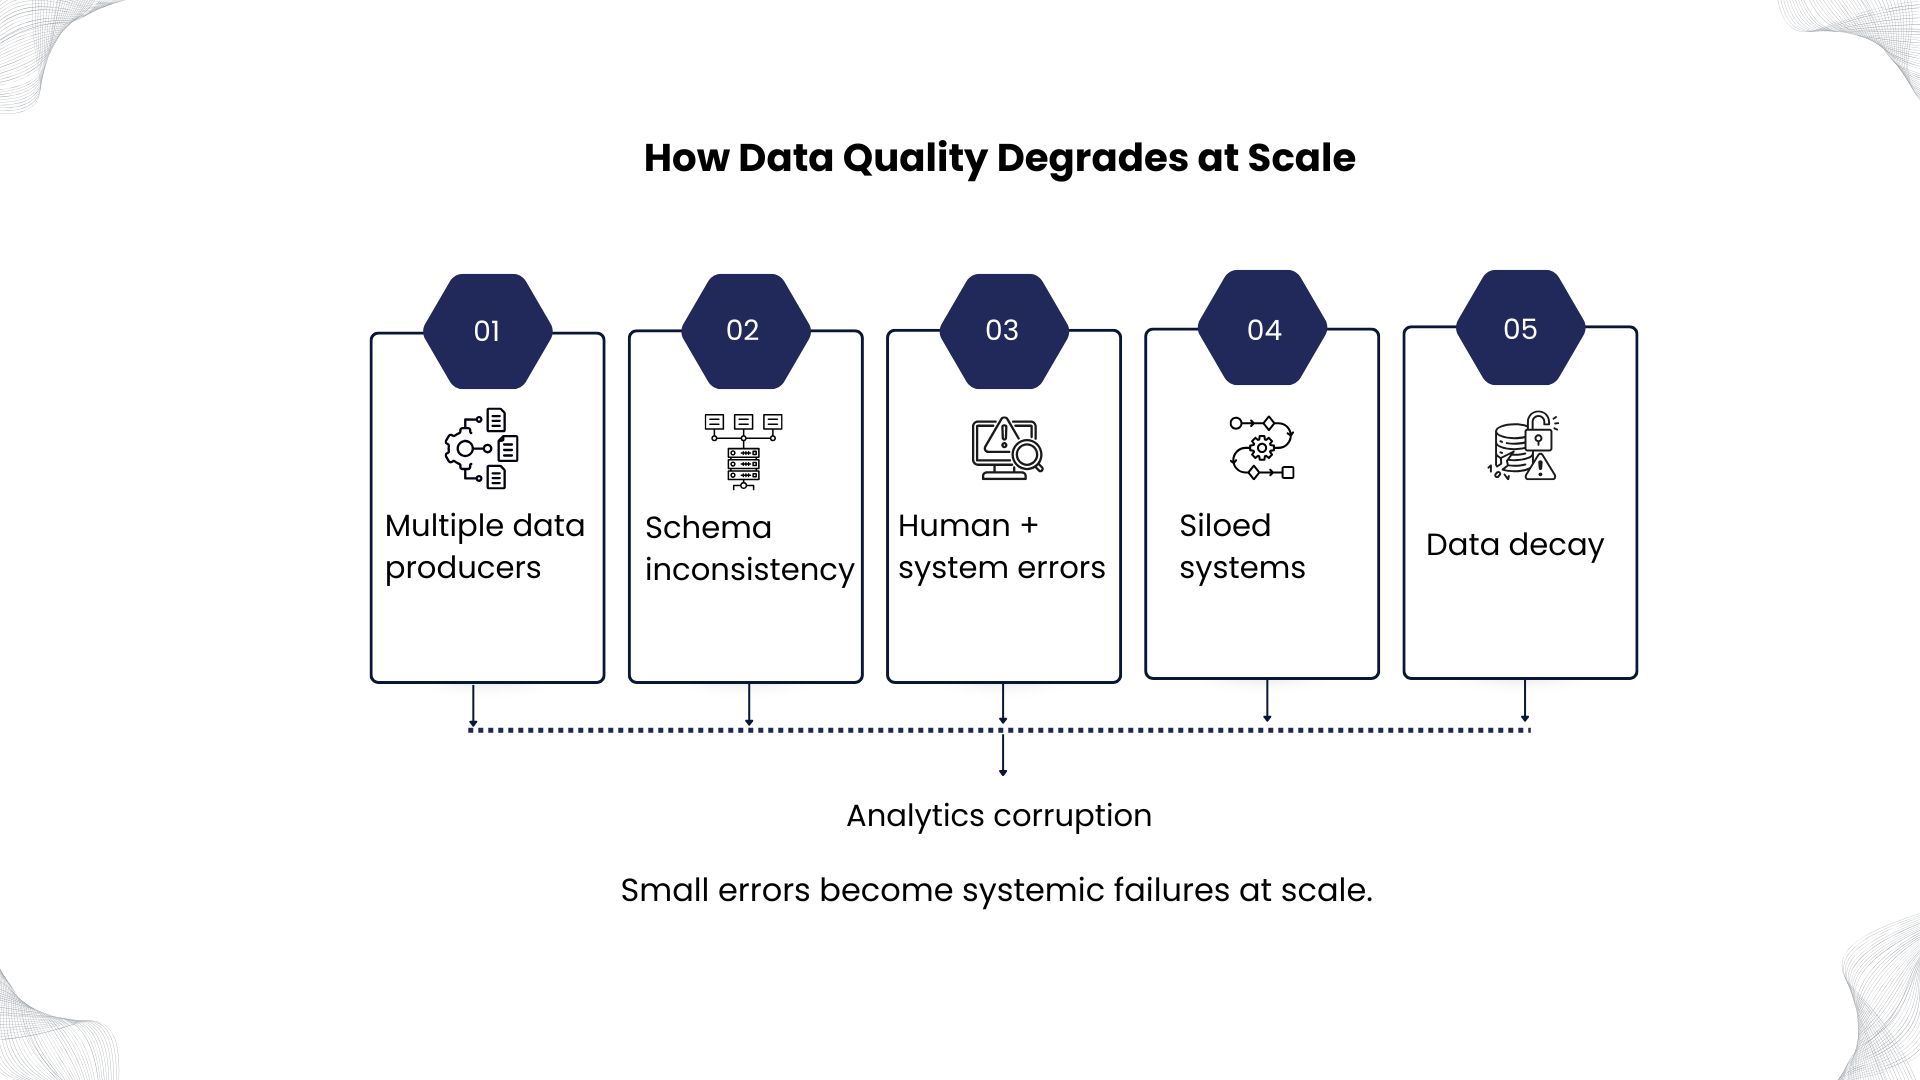
Data quality problems don't emerge randomly. They're systematic failures that compound as organizations grow.
Multiple data producers create inconsistency
According to the 2025 Connectivity Benchmark by MuleSoft, modern B2B companies on average have as many as 897 applications. Only 29% of these are integrated. Each disconnected system is like an island of information, having its own data standards, validation rules, and quality expectations.
Your sales CRM captures lead source as "paid search." Marketing automation records the same information as "PPC." Customer success logs the identical lead as "Google Ads." When these systems feed a central analytics platform, the data appears contradictory. Analysts waste hours reconciling these differences rather than extracting insights.
Sales teams enter customer information manually. Marketing platforms ingest third-party lead data. APIs pull information from external partners. Each source introduces quality issues, from missing fields to incorrect formats to duplicate entries. One demand generation platform discovered 15 to 20% inconsistency rates from siloed SDR inputs clashing with automated webhooks, cascading into faulty cohort analysis.
Schema inconsistency undermines reliability
In traditional databases, schema changes were rare, controlled events. In modern analytics environments with continuous deployments and rapid iteration, schemas change constantly. A developer adds a new field to track campaign attribution. Another team modifies the structure of transaction records. These changes rarely coordinate across all data consumers.
Downstream systems expecting specific data structures receive different formats. Pipelines break. Analytics queries fail. Dashboards show incomplete information. By the time teams discover these failures, days or weeks of corrupted data have accumulated. A "lead score" field numeric in production but string in staging breaks reporting without warning. New GDPR fields appear without notice, halting data flows.
Human and system errors propagate exponentially
According to recent research published in the Harvard Business Review, at least one major inaccuracy exists in 47% of freshly created data records. Mistyped customer IDs, forgotten mandatory fields, or inconsistent codes corrupt reports before they reach ETL processes. These entry errors appear minor individually but create massive downstream impacts at scale.
A marketing team member duplicates a campaign code. A sales rep enters customer revenue in the wrong field. Each error, if not caught immediately, replicates across partitions, propagates to every downstream system, and corrupts months of historical data. System errors compound these problems. Transmission errors during data transfer, integration flaws during migration, and processing bugs during transformation all introduce quality issues.
Surveys show data decay affects 3% of records monthly, turning fresh leads into ghosts.
Common Data Quality Issues
Understanding specific quality problems helps organizations prioritize detection and remediation efforts.
Missing or duplicate data
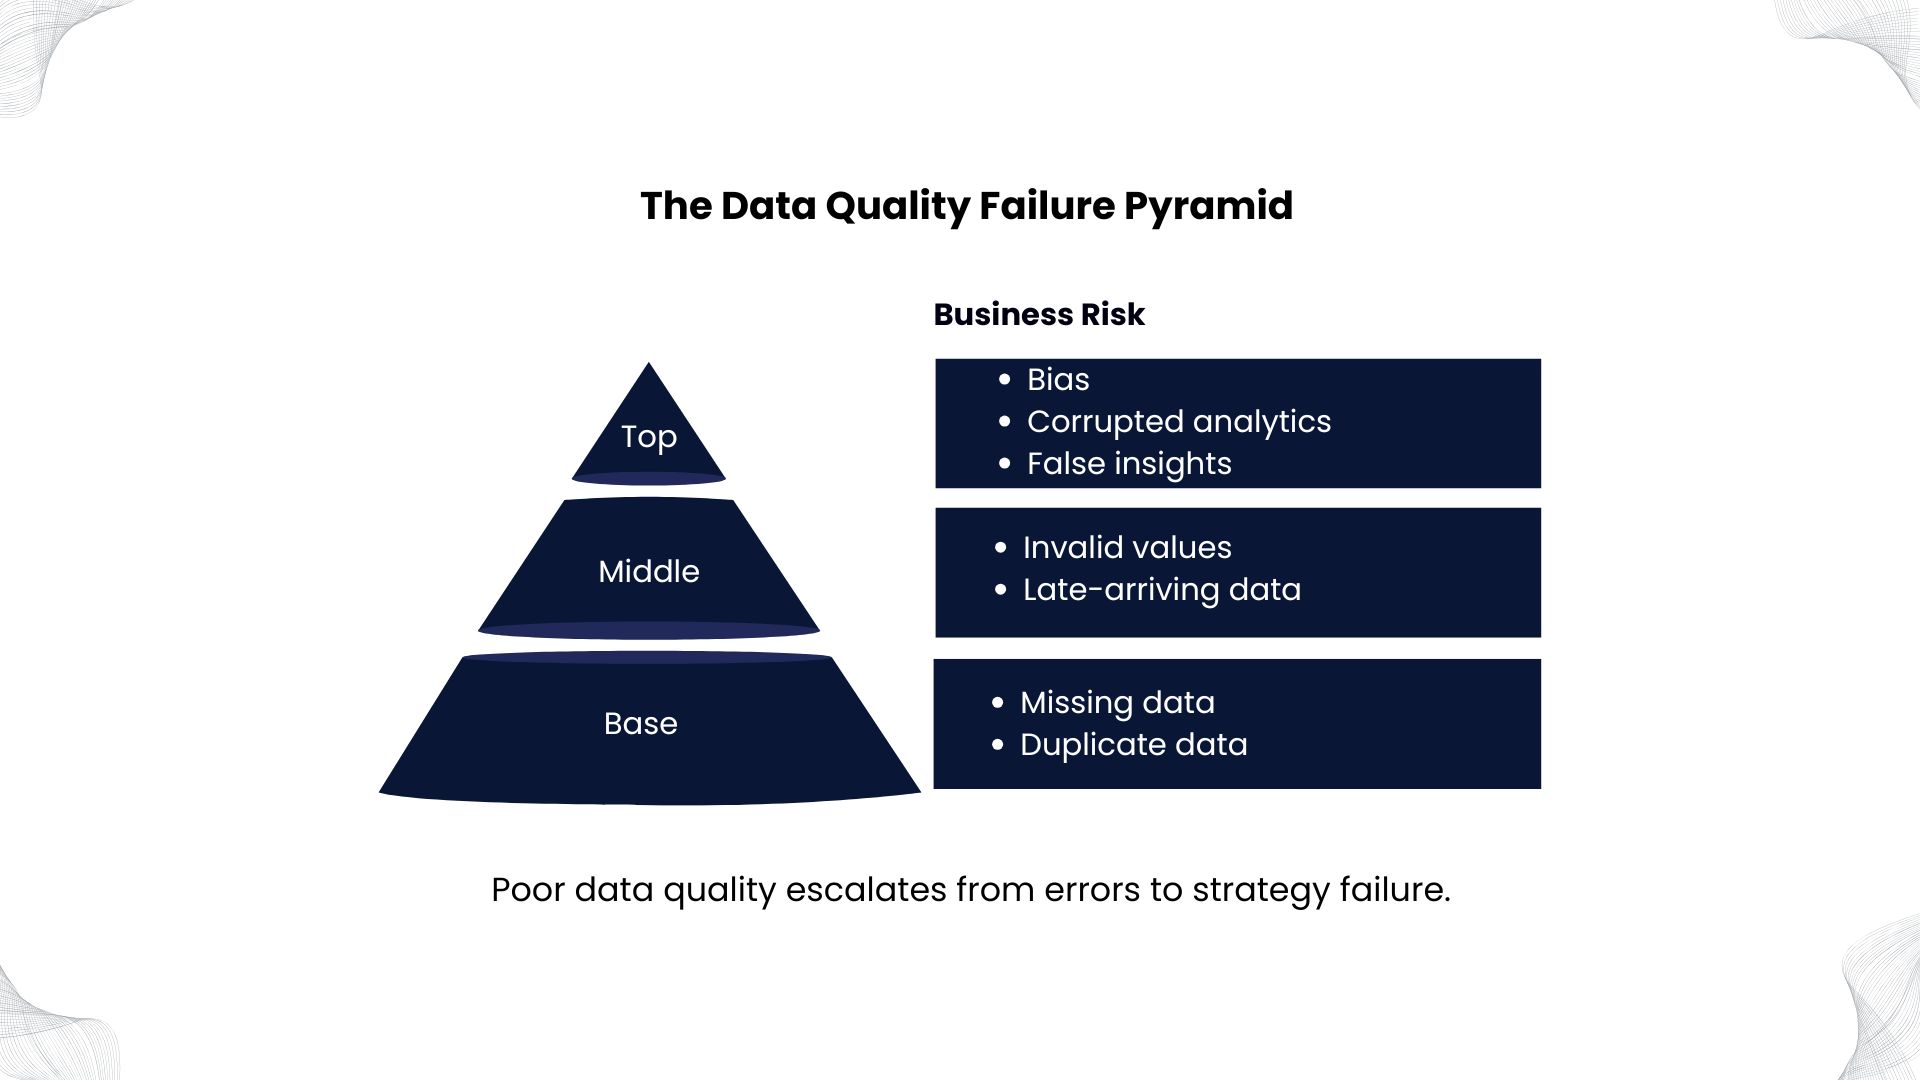
Missing data undermines completeness. Marketing campaigns are unable to target client records that do not have email addresses. Time-series analysis is not possible when timestamps are missing from transaction records. When lead records lack source attribution, marketing ROI calculations fail. Incomplete CRM records leaving 25% of leads without phone numbers cripple outbound efforts.
Duplicate data creates the opposite problem. When the same customer appears twice in a database, campaign targeting sends redundant messages. When the same transaction records twice, revenue reports inflate. Duplicates plague merges. Pipeline metrics are inflated by 10 to 15% when two SDRs claim the same prospect, resulting in "phantom" conversions. Research shows duplicate data causes organizations to overestimate key metrics by 30% or more.
Invalid values and late-arriving data
Invalid values represent data violating business logic or technical constraints. A percentage field containing 150. An age field showing negative 5. A date field displaying February 30. More insidious are values technically valid but contextually wrong. A customer record showing a location in California when the customer operates in New York. A lead score of 100 when the maximum score should be 50.
Data bias has emerged as a critical quality issue. According to IBM research, biased data contributes to inaccurate model outputs resulting in legal liability, discrimination, and poor customer service. When sales teams preferentially update records for large accounts, small customer data grows stale. When marketing platforms oversample certain demographics, campaign analysis becomes unrepresentative.
In real-time analytics environments, data freshness determines value. Late-arriving data from async sources like batch email exports disrupts dashboards. A delayed Facebook Ads feed makes yesterday's ROI look stellar until the truth hits. When yesterday's web analytics data arrives tomorrow, campaign optimization decisions use outdated information. A SaaS company chased "hot leads" from a dashboard showing 40% engagement, but invalid email formats meant zero deliverability, burning $50,000 on futile nurturing.
Detecting Data Quality Problems
Reactive quality management waits for problems to surface through failed reports. Proactive quality management detects issues immediately and prevents downstream impacts.
Validation rules catch obvious errors
Validation rules define acceptable data characteristics and flag violations. Range checks ensure numerical values fall within expected parameters. Format checks verify data matches required patterns. Referential integrity checks confirm relationships between datasets remain consistent.
A recent report from Gitnux found 60% of all business data is inaccurate, making validation from the start critical. For B2B analytics systems, validation rules should address required fields (customer email, lead source, transaction date), data types (numbers stored as numbers, dates as dates), value ranges (scores between 0 and 100, percentages 0 to 100%), and business logic (renewal dates after purchase dates, closed deals have amounts).
Validation rules operate at multiple pipeline stages. Input validation catches errors during data entry. Transformation validation detects issues during ETL processing. Output validation verifies data meets downstream requirements before delivery. The primary challenge is that as business needs change, validation rules must be updated on a regular basis.
Statistical anomaly detection identifies unusual patterns
Rule‑based validation detects known error types, while anomaly‑detection methods identify data points that deviate from expected patterns. Statistical techniques like Z‑Scores flag extreme outliers, and machine‑learning, especially unsupervised models, learn historical behavior to surface unexpected changes. Modern data quality platforms typically combine these complementary methods to improve detection accuracy.
In B2B analytics environments, anomaly detection is particularly effective for identifying unusual spikes in lead volume that may indicate bot activity or duplicate records, sudden fluctuations in campaign performance that suggest tracking issues, and revenue irregularities that may result from pricing errors.
Freshness and volume checks ensure completeness
Data arriving on time but in incomplete volumes still creates quality problems. Freshness checks verify data arrives within expected timeframes. Volume checks confirm expected data quantities. For daily batch processes, freshness checks flag datasets not updating on schedule. A daily customer data refresh running Monday through Thursday but failing Friday signals a process failure.
In a 12-month period, a healthcare institution that integrated metadata validations reduced mistakes by 250%, guaranteeing that doctors trusted patient analytics for resource allocation.
Impact on Decision-Making and Analytics
Analysts are not just inconvenienced by poor data quality. Even the decision velocity contributes to the damage.
Misleading dashboards drive flawed strategy
Executives rely on dashboards to make critical decisions. When the underlying data contains quality issues, these dashboards present fiction as fact. A CMO reviewing yesterday's campaign performance adjusts today's budget allocation. A sales leader examining this week's pipeline revises next quarter's forecast. Each decision based on corrupted data drives strategy in the wrong direction.
Marketing invests more budget in underperforming channels because data inflated their results. Sales teams chase phantom pipeline opportunities that do not exist. Organizations that have poor data quality experience project failure rates that are 60% higher compared to businesses that have strong data quality programs. Such failures include missing revenue targets, marketing spend going to waste, and strategic initiatives that are based on wrong assumptions.
Erosion of trust paralyzes data-driven culture
It is pretty much natural for them to stop trusting data completely if business users get inconsistent dashboards, contradictory reports, or clearly wrong figures. Data Integrity Trends Report 2025 reveals that 67% of companies lack trust in their data for decision, making purposes, which is a rise from 55% in the previous year.
Marketing executives ignore campaign analytics and make decisions based on their gut feeling. Salespeople disregard the pipeline forecasts and trust their own experience. This vicious circle continues. When teams stop trusting data, they stop reporting quality issues. As quality issues go unreported, they accumulate. As problems accumulate, trust declines further.
Downstream model failures cascade through AI initiatives
For organizations investing in AI and machine learning, data quality becomes existential. Models which are trained with improper data make inaccurate forecasts. For instance, if a lead scoring model is trained on partial customer data, it will produce wrong scores; as a result, marketing automation will mistakenly downgrade the priority of high, value leads. Studies reveal that 74% of businesses cannot increase AI value at scale although 78% adoption rate. One of the major reasons is poor data quality.
A fintech company's garbage customer data led to 18% mispriced loans, costing $2 million in write-offs and regulatory fines.
Building Data Quality into Pipelines
Reactive quality management catches problems after they occur. Proactive quality management prevents problems from entering systems. Instead of considering quality as an afterthought, this "shift-left" method integrates quality controls across data pipelines.
Shift-left validation prevents downstream contamination
Traditional data quality programs focus on cleaning data after collection. Modern programs validate data at the source, preventing bad data from entering pipelines. Input validation operates at the point of data creation. Web forms verify email formats before submission. CRM systems require mandatory fields before saving records. API integrations validate payloads before accepting data.
Transformation validation ensures ETL processes maintain quality rather than degrade. Each transformation step includes checks verifying outputs meet expected characteristics. If a data aggregation produces unexpected results, the pipeline halts rather than delivering corrupted data to downstream consumers.
Automated checks scale with data volume
Manual data quality review becomes impossible at scale. Modern data quality platforms provide comprehensive automation across multiple dimensions. Schema validation catches structural changes automatically. Duplicate detection flags redundant records without human intervention. Anomaly detection using machine learning identifies unusual patterns across billions of rows.
Automation enables continuous quality monitoring. Rather than periodic quality audits, automated systems assess quality with every pipeline run. Real-time alerts notify teams in charge as soon as issues are detected, allowing them to respond quickly before the problems get worse. By automating freshness and volumetrics, a certain analytics company cut down the rework of dashboards by 40% and raised the return on campaign investment by 22%.
Ownership and accountability create sustainable quality
Technological tools cannot ensure data quality on their own. Long, lasting quality calls for clear ownership, accountability, and cultural commitment. A decentralized approach to ownership is one where the teams that produce and consume data are held accountable for its quality. Engineering teams own data pipeline quality. Marketing teams own campaign data quality. Sales teams own CRM data quality.
Accountability mechanisms reinforce ownership. Cost allocation models charge teams for their data consumption, creating financial incentives for quality. Quality scorecards make team performance visible to leadership. Maintaining a culture that values data stewardship will take a lot of education and communication as a continuous process. Teams will require sessions on quality best practices, instruments for detecting and resolving issues, and illumination into how quality problems affect the business.
Organizations that implement systematic quality programs report average 25% to 30% reduction in quality-related costs while improving decision accuracy and analytical velocity. Data quality isn't an IT problem. Organizations lose an average of 25% of revenue annually due to quality-related inefficiencies and poor decisions. This represents capital funding for customer acquisition, product development, and market expansion.
Visibility into current quality levels must be the first step. Validation and detection capabilities must be implemented to catch issues at an early stage. Your organization should have ownership and accountability built into it. After that, as data volumes increase and requirements change, keep on improving your method.
Organizations that will win in 2026 will consider data quality as a competitive edge. They can make decisions quickly and accurately because their data is reliable.