
Article
Data Observability: Monitoring the Health of Analytics Systems
This blog explains why traditional monitoring fails to catch the silent degradation of data pipelines; where systems keep running but data becomes incomplete, stale, or structurally broken. It introduces the five pillars of observability (freshness, volume, distribution, schema integrity, and lineage) and makes the case that trust in data infrastructure depends not on faith but on continuous, automated visibility into system health.
- Topic
- Data Engineering and Analytics
- Published
- 4 Jun 2026

The Silent Failure Problem
Your dashboard shows revenue up 15%. Two weeks later, you discover a pipeline silently dropped 40% of transaction records. The dashboard was never wrong. It just reported on incomplete data. No alert fired. No error logged. No one knew.
This defines the structural vulnerability in modern analytics infrastructure. As marketing systems evolve from simple campaign tools into complex data ecosystems, their failure modes become opaque. Traditional monitoring tracks whether systems are running. Data observability tracks whether the data flowing through those systems remains reliable enough to drive decisions.
The distinction matters because data pipelines rarely crash. They degrade. A customer data platform ingests records successfully while dropping critical fields due to schema mismatches. An attribution model generates reports even as underlying data becomes stale by 48 hours. A segmentation engine processes millions of profiles while demographic accuracy drifts undetected.
According to Gartner research, poor data quality costs organizations an average of $12.9 million annually. These losses accumulate not through dramatic infrastructure failures, but through the quiet degradation of unobserved systems.
From Monitoring to Observability
Monitoring asks: "Is the system running?" Observability asks: "How is the system behaving, and why?"
Traditional monitoring is threshold-based. A job failed. CPU spiked. Service slowed. It alerts on known failure states but has a critical blind spot: if something breaks in a way you didn't anticipate, monitoring won't catch it. If no one configured the system to detect slow drift in customer sign-ups, that issue flies under the radar for weeks.
Data observability functions like a diagnostic layer. It not only detects problems but explains what happened, shows full impact, and enables prevention. This shift becomes critical as analytics move from static reporting to always-on infrastructure for AI, personalization, forecasting, and operational decision-making.
The most common observability failure is the assumption that pipeline completion equals data validity. A pipeline can ingest data successfully into a raw layer while downstream logic corrupts business-ready tables. Without layered observability, teams discover problems only when stakeholders notice inconsistent dashboards or broken workflows.
The Five Signals of System Health
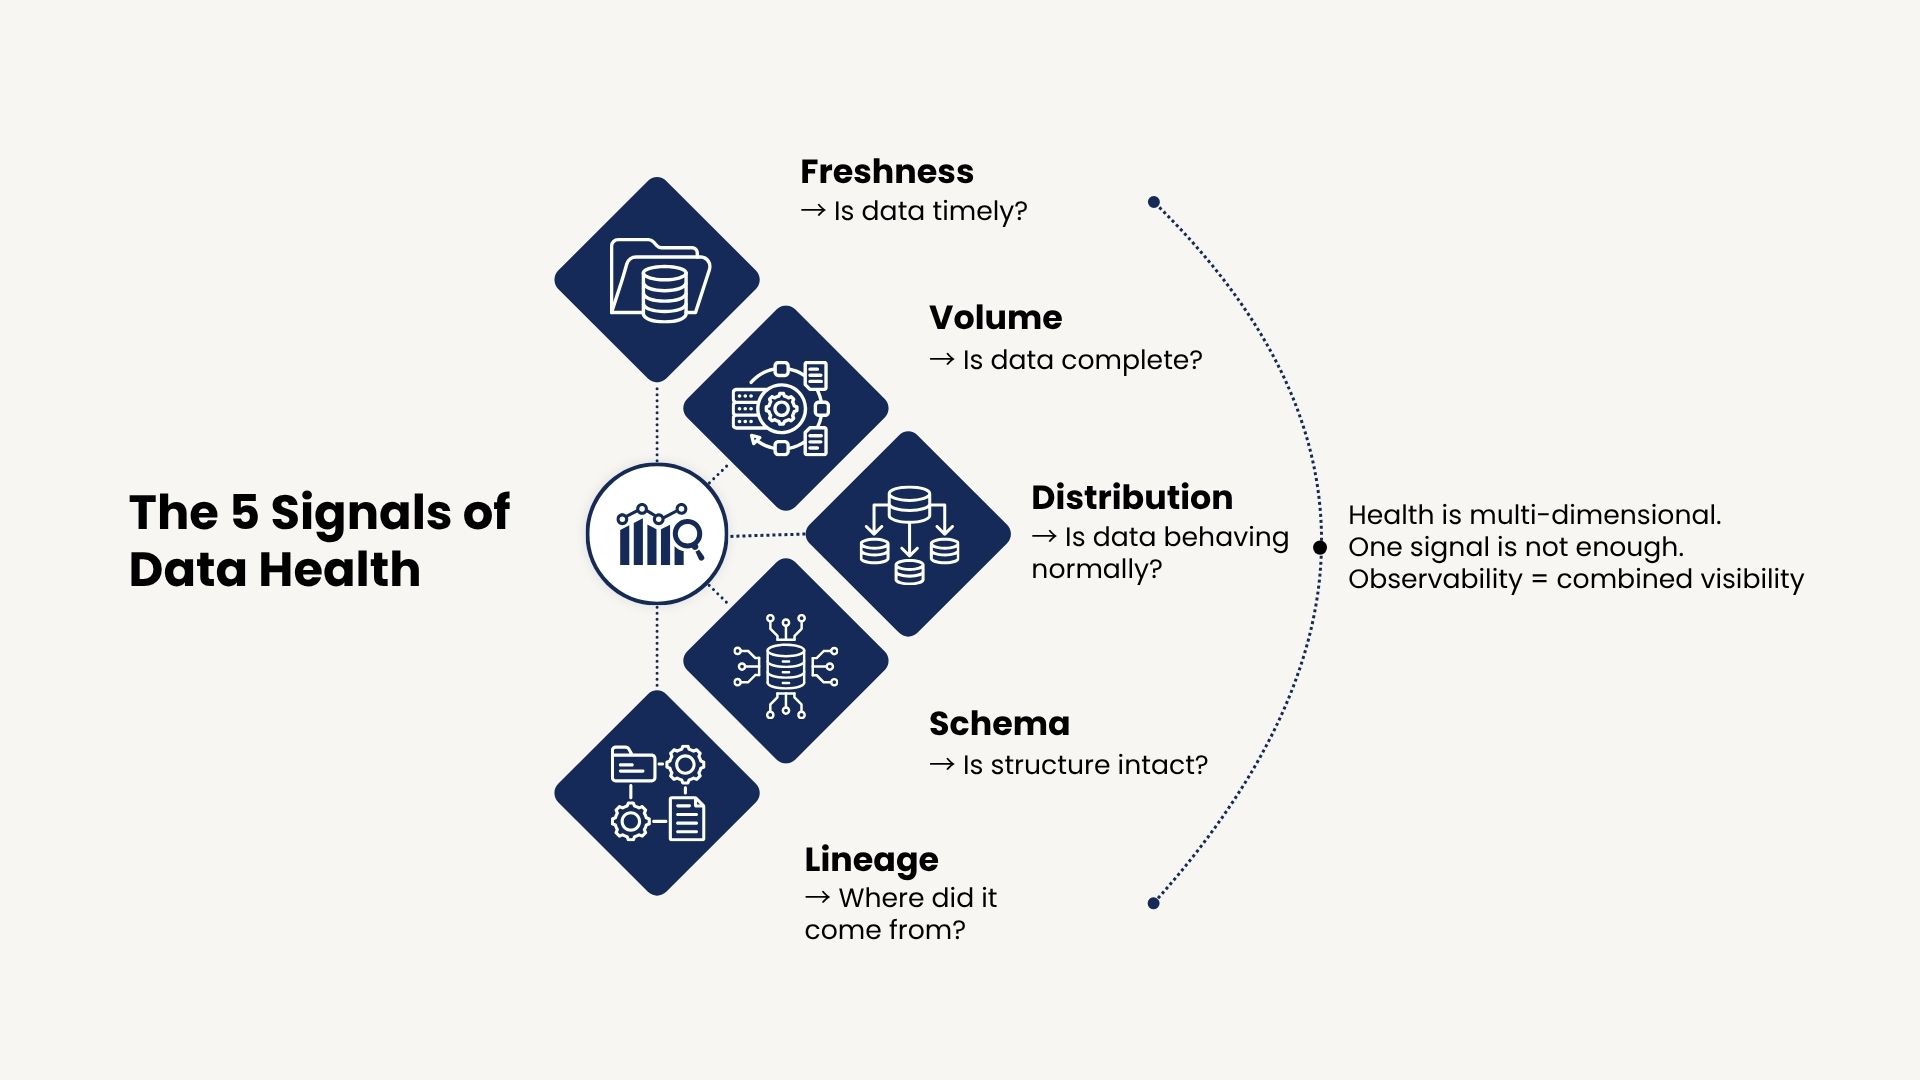
Mature data observability operates through five interconnected signals that reveal analytical infrastructure health.
Freshness: The Temporal Dimension
Freshness measures the gap between when an event occurs and when it becomes available for analysis. This defines decision-making windows. Real-time bidding requires sub-second freshness. Daily optimization tolerates hourly delays. Strategic planning operates on weekly cycles.
Freshness requirements cascade through dependent systems. When a customer data platform experiences a six-hour ingestion delay, impact propagates to audience builders, journey orchestration, predictive models, and attribution systems. Each operates on stale data while appearing functional. A report that is six hours late may be technically correct but commercially irrelevant.
Volume: Detecting Structural Changes
Volume anomalies reveal upstream breakage before it manifests in business metrics. A 30% drop in impression data indicates tracking implementation failure. Sudden spikes in null values suggest schema misalignment. Gradual volume decay signals infrastructure degradation.
If your orders table normally streams 10,000 records per hour and suddenly drops to 500, something is wrong upstream even if the pipeline reports no errors. Time-aware thresholds that account for daily and weekly patterns are essential for distinguishing meaningful deviation from expected variance.
Distribution: The Shape of Data
A dataset can remain fresh and complete while becoming analytically dangerous. Distribution shifts in values, categories, or metric ranges indicate source changes, transformation issues, or genuine behavioral shifts that downstream models and dashboards weren't designed to absorb.
A lead scoring model processing the same record count daily but scoring 80% of leads above threshold signals model drift or upstream data quality issues. The volume is correct. The composition has changed. Silent distribution changes distort attribution, segmentation, and machine learning outcomes without triggering job failures.
Schema Integrity
Schema drift is the silent killer. When a source system renames a column, changes a data type, or adds a field without warning, downstream transformations break. The pipeline may complete successfully, but data silently lands in wrong columns or critical fields return null values.
Effective schema monitoring flags changes immediately, allowing teams to assess impact before transformations break. This converts schema evolution from risk into managed process.
Lineage: The Map of Truth
Lineage traces the path data takes from source to destination and every transformation between. When something breaks, lineage identifies what is affected downstream. When a dashboard shows wrong numbers, lineage points to which upstream system to investigate.
This is the most strategic pillar. It enables rapid root cause analysis by connecting anomalies to upstream sources, transformations, and dependent jobs. The goal is not just detecting that a table is wrong, but locating where degradation originated.
The Diagnostic Framework: From Detection to Resolution
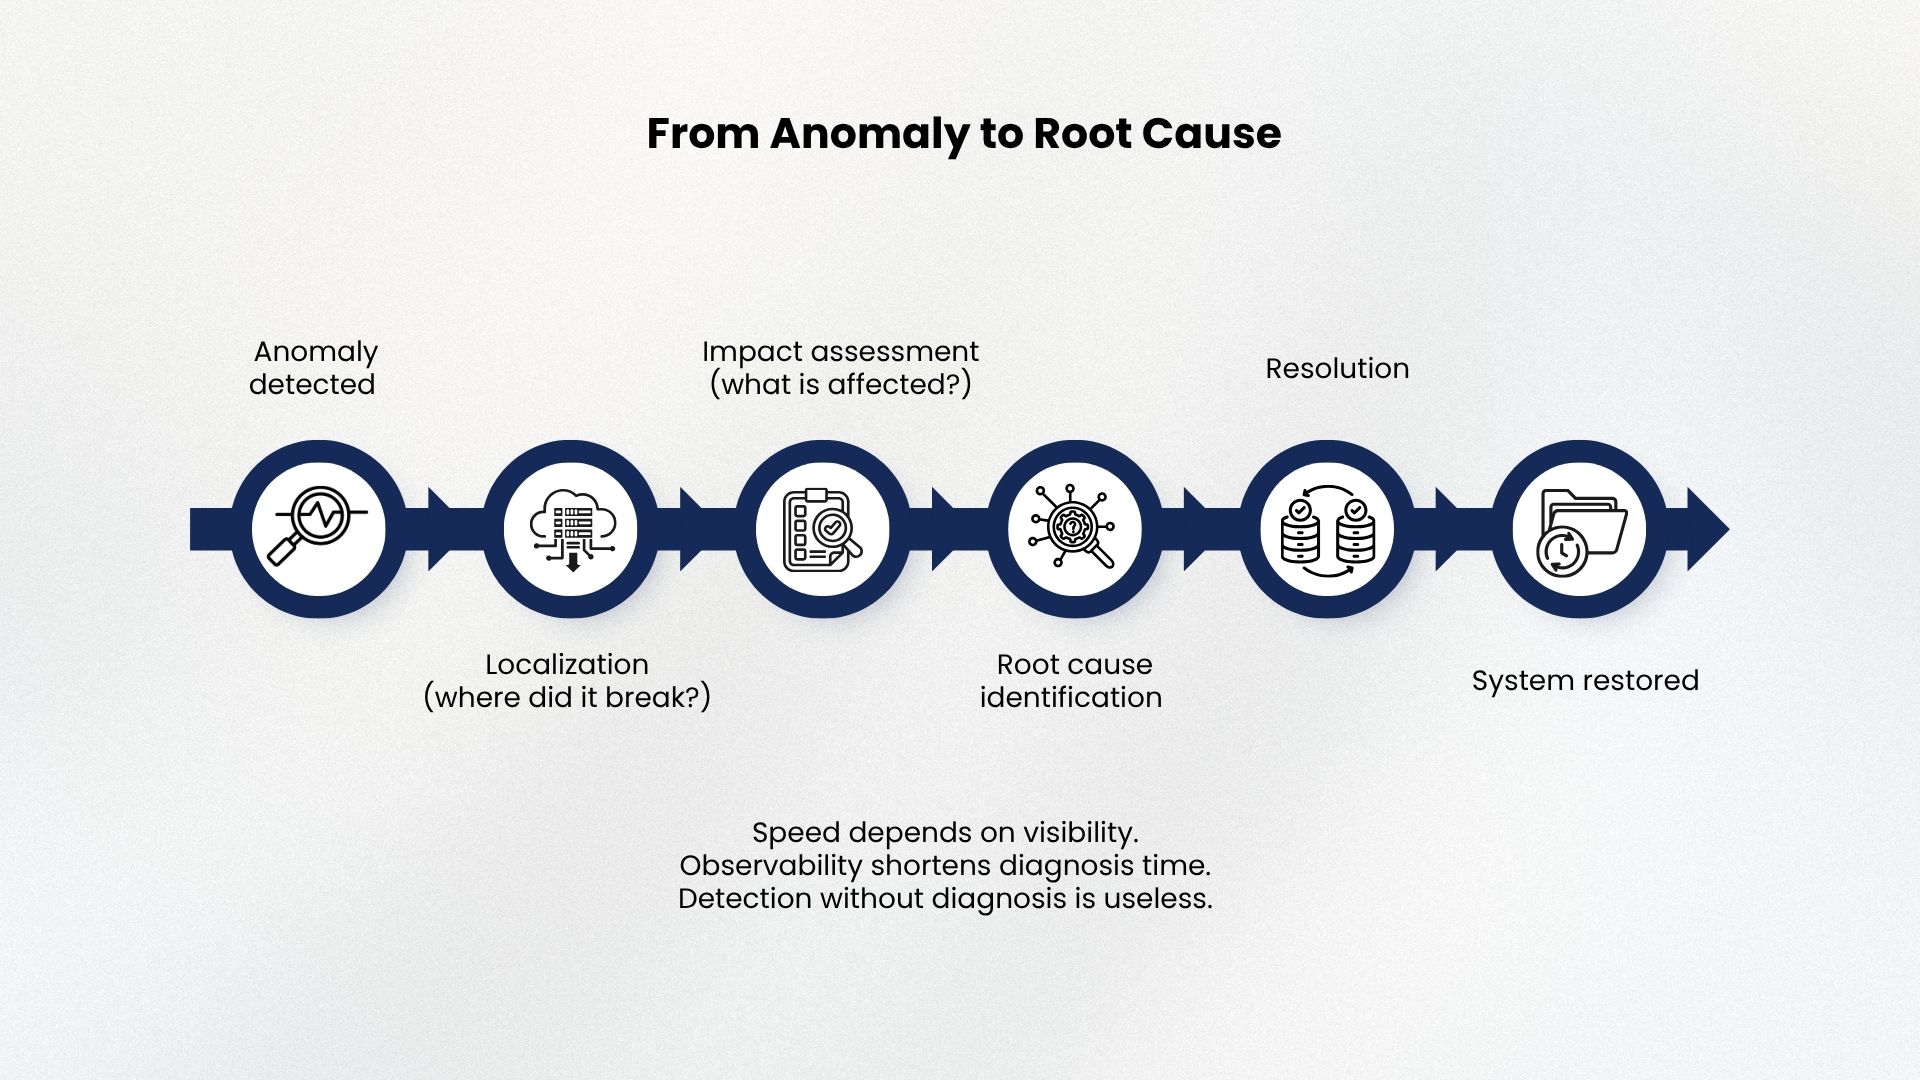
Identifying system degradation is necessary but insufficient. Mature observability provides diagnostic pathways that accelerate root cause identification and impact assessment.
When an anomaly surfaces, the first question is localization: where in the data pipeline did the issue originate? Observability systems segment infrastructure into observable units and instrument each independently. If impressions are stale but clicks are current, the issue is upstream of conversion tracking. If all marketing automation data is delayed uniformly, the integration layer is implicated.
Impact assessment follows: which business processes depend on degraded data? Platforms that maintain dependency graphs automatically identify affected stakeholders and systems. Teams move from "something is wrong" to "this specific component failed, affecting these processes, requiring this intervention" in minutes rather than hours.
Leading organizations have transformed incident response by starting with business impact rather than infrastructure signals. Instead of spending hours translating infrastructure alerts into business consequences, teams immediately understand blast radius and prioritize response based on business criticality.
Building the Intelligence Layer
Manual inspection of data health signals doesn't scale. Marketing systems generate millions of data points hourly across dozens of pipelines. Observability relies on automated anomaly detection informed by machine learning.
Effective automation distinguishes between expected variance and meaningful deviation. Sophisticated approaches model historical patterns including seasonality, promotional cycles, and growth trends to establish dynamic baselines that adapt over time. A model trained on three months of data recognizes that Monday sends run 40% higher than Friday, promotional weeks generate 3x volume, and gradual decay over days indicates infrastructure issues.
The intelligence layer transforms observability from reactive to proactive. Rather than discovering data quality issues when they impact business outcomes, teams identify degradation early in its lifecycle. This shift from firefighting to preventive maintenance represents fundamental maturity in operating analytical infrastructure.
Alerting strategy is equally critical. Not every anomaly deserves the same urgency. A five-minute delay in a noncritical table differs from schema drift in a metrics table feeding executive reporting or personalization systems. Alerting should be tied to business criticality, not just technical deviation.
Organizational Architecture: Ownership and Response
Technology enables observability, but organizational structure determines whether it creates value. Data observability fails when treated as a platform feature instead of an operating model.
Ownership must be explicit. Someone must own the health of critical tables, response to anomalies, and escalation paths when business-facing data is compromised. High-performing teams define what happens when a freshness SLA fails, when a distribution anomaly affects a model feature, or when a schema change threatens downstream dashboards.
Organizations that treat data incidents with the same rigor as application outages build analytical infrastructure that compounds strategic advantage. This includes defined severity levels, escalation paths, and communication protocols that mirror those used for application incidents. Data incidents are business incidents and deserve equivalent rigor.
Strategic Implications: Trust as Infrastructure
The business case for data observability extends beyond risk mitigation. While preventing analytical errors that misallocate budget provides clear ROI, the larger impact lies in how observability changes organizational relationship with data infrastructure.
Trust enables velocity. When teams lack confidence in data quality, they slow decision-making to validate analyses manually. They build redundant verification steps. They delay launches pending confirmation. This friction compounds across the organization, creating drag that competitors without data trust issues don't experience.
Observability converts trust from faith into evidence. Rather than believing data is reliable, teams know it's reliable because systems continuously validate integrity. This evidenced trust enables faster iteration, aggressive experimentation, and greater willingness to automate decisions. Each translates into competitive advantage where speed and precision determine outcomes.
As analytics systems move toward supporting AI, recommendation engines, campaign triggers, and operational intelligence through continuous data flows, observability becomes prerequisite for trust. Without it, organizations scale not intelligence, but hidden fragility. With it, they create feedback systems that support reliability, faster diagnosis, and better governance.
Conclusion: Infrastructure as Competitive Moat
Data observability matters because modern analytics systems do not fail cleanly. They fail gradually, partially, and often invisibly. Monitoring jobs and infrastructure is no longer enough.
The organizations that lead in the next phase of analytics will not simply have more dashboards or more data. They will have better visibility into whether their data remains healthy enough to be trusted. In markets where differentiation increasingly depends on execution speed and decision precision, data observability transitions from operational hygiene to strategic imperative.
You cannot fix what you cannot see. And in the modern data landscape, visibility is the foundation of trust.