
Article
Analytics Cost Optimization: From Infrastructure Spend to Intelligence Architecture
This blog explains why cloud analytics costs compound faster than value in modern GTM stacks; driven by query proliferation, redundant storage, and idle compute, and why treating cost as an afterthought is a design problem, not a billing issue. It covers optimization techniques (partitioning, materialized views, data lifecycle management), a cost-efficiency maturity framework, and the governance structures needed to transform cost management from reactive finance exercise into architectural discipline that enables sustainable competitive advantage.
- Topic
- Data Engineering and Analytics
- Published
- 23 Jun 2026

The Strategic Shift That Changed the Cost Equation
Something fundamental changed when analytics stopped being a support function and became the operational backbone of marketing, sales, and revenue operations. Data warehouses now power predictive lead scoring, real-time personalization, multi-touch attribution, and AI-driven forecasting. Every decision that once lived in spreadsheets now runs through cloud compute.
That shift created a new financial reality. Traditional software licensing followed flat, predictable curves. Cloud analytics infrastructure operates on metered consumption: every query, every transformation, every model retraining cycle generates a direct cost. A 2025 benchmark of GTM-driven data warehouses found that cloud analytics spend grew 58% year-over-year, while revenue per analytics dollar improved by only 14%. The gap between capability and financial efficiency is widening.
This is not a billing problem. It is a design problem. Organizations that treat cost as an afterthought, something to address once the invoice arrives, are building systems architected for flexibility but not for sustainability. The organizations that will scale AI-driven marketing successfully are those that embed cost efficiency as a first-class principle from the start.
Why Analytics Costs Compound Faster Than Value
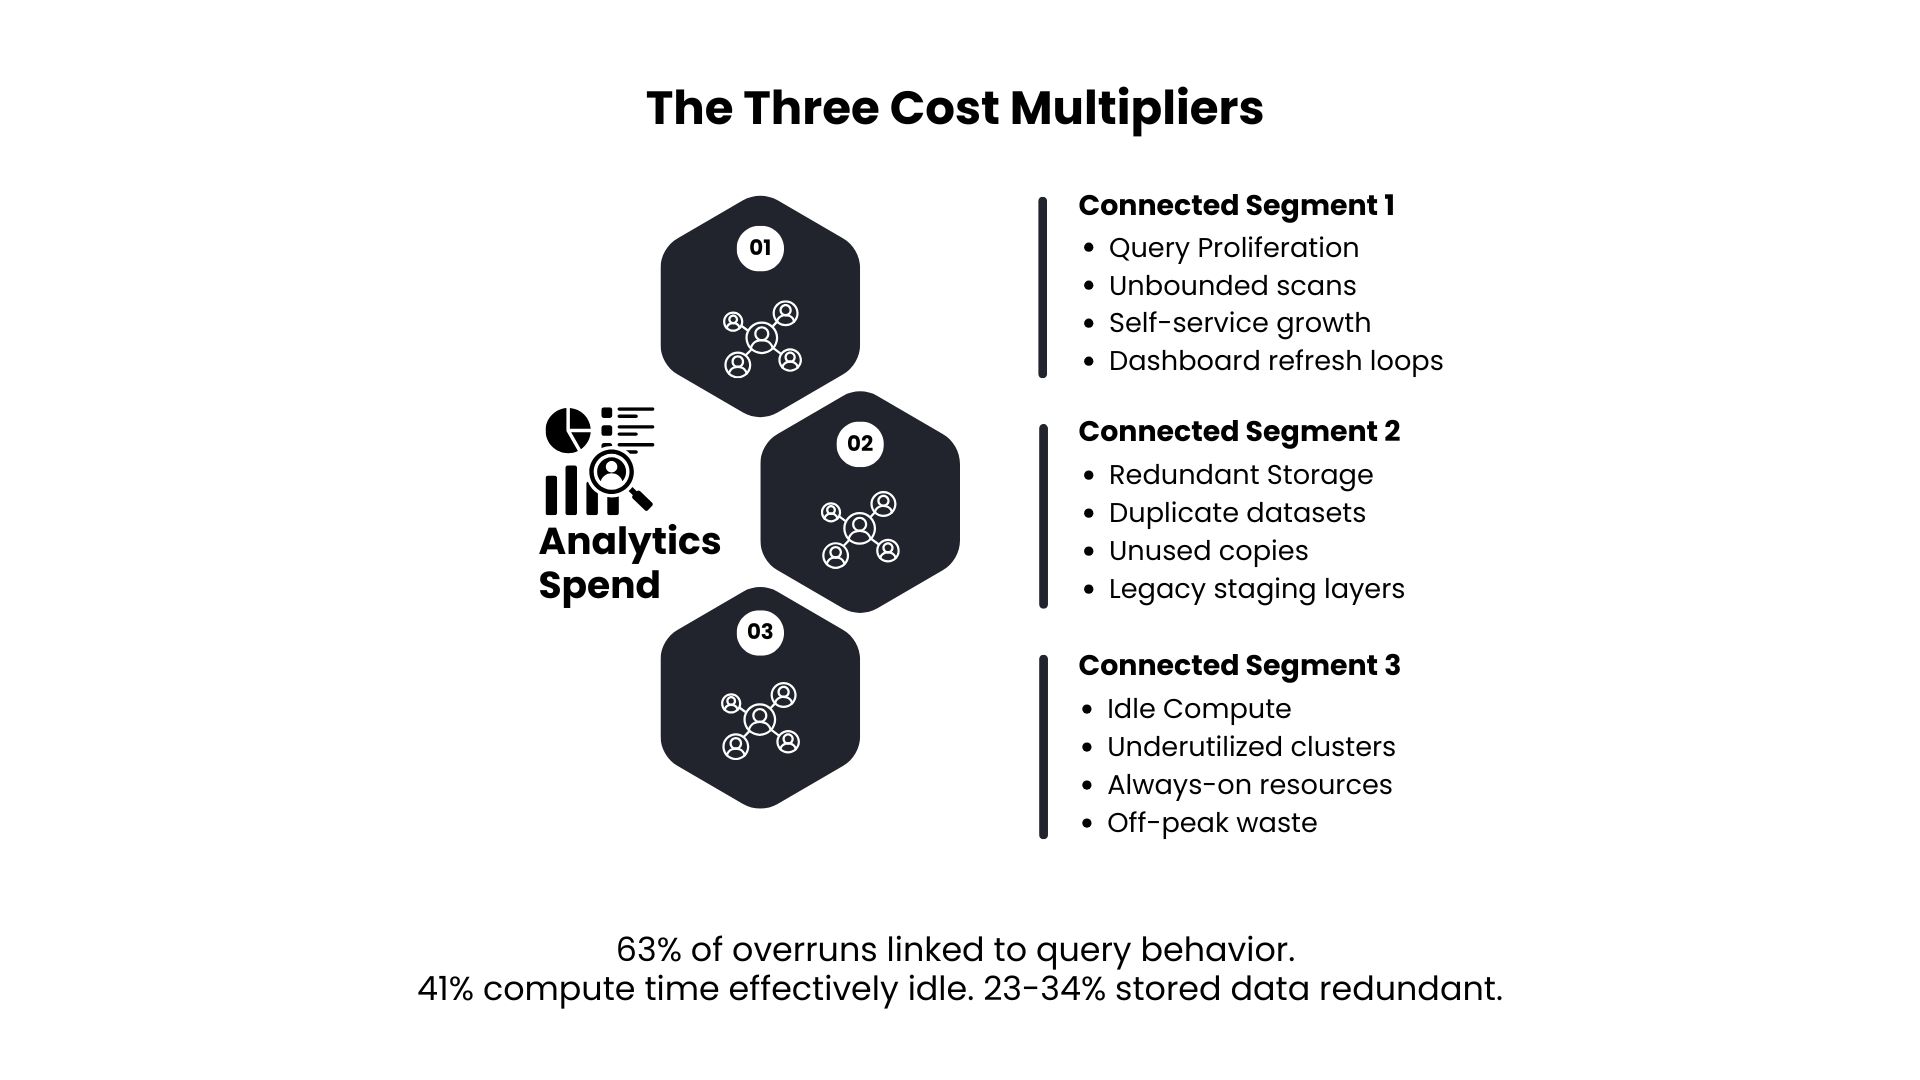
Three structural forces drive cost escalation in modern analytics environments.
The first is query proliferation without constraint. When analytics becomes self-service, query volumes increase sharply. A 2024 RevOps benchmark found that 63% of warehouse cost overruns were driven by a small subset of power users running unbounded, scan-heavy queries. In one case, a single GTM dashboard was refreshing every 15 seconds and scanning 1.2 billion records, accounting for 19% of total warehouse spend. The problem is not that people are querying data. The problem is that cost remains invisible until the bill arrives.
The second force is redundant storage that compounds silently. In most GTM stacks, the same dataset exists in multiple forms: raw event tables, aggregated staging layers, BI exports, and finalized star schemas. A 2025 data cost study found that 23 to 34% of stored data in GTM-driven warehouses was redundant or stale, yet was still being retained, backed up, and processed. Storage costs appear modest per terabyte, but the cumulative compute required to process redundant copies multiplies quietly.
The third is idle compute. Cloud warehouses charge when compute is active, not just when results are useful. A 2024 audit of 38 GTM stacks showed that 41% of compute time was effectively idle, with warehouses sitting below 20% utilization while incurring full compute charges. Shifting BI refreshes to off-peak windows and right-sizing clusters can reduce monthly bills by 28% with no impact on performance. The issue is that without usage-aware architecture, organizations rent their analytics infrastructure rather than operate it.
The Real Cost Structure: What Actually Drives the Bill
Understanding where money goes is the prerequisite to changing how it gets spent.
Compute is the dominant and most volatile line item, representing 60 to 80% of total warehouse spend. Storage, while growing with retained data and duplicate copies, is typically 20 to 30% of spend and more predictable. Egress fees and cross-region data movement can represent an additional 10 to 20% in multi-cloud environments. Optimizing query performance generates larger financial returns than deleting old data because compute, not storage, is where spend spikes occur.
Within compute, query patterns determine efficiency. Not all queries cost the same. A Fortune 500 retailer discovered that 6% of their marketing analytics queries, primarily ad hoc explorations from analysts prototyping attribution models, consumed 61% of their monthly warehouse compute budget. A 2024 RevOps case study found that 12% of queries accounted for 74% of compute cost, while 39% of queries were one-off exploratory work with minimal downstream impact. The system was charging for experimentation at the same rate as production-critical analysis.
This exposes a structural misalignment: the teams closest to strategic questions, data science and marketing analytics, are often furthest from cost accountability, while the teams managing infrastructure lack business context to determine what each query is actually worth.
Optimization Techniques That Compound Over Time
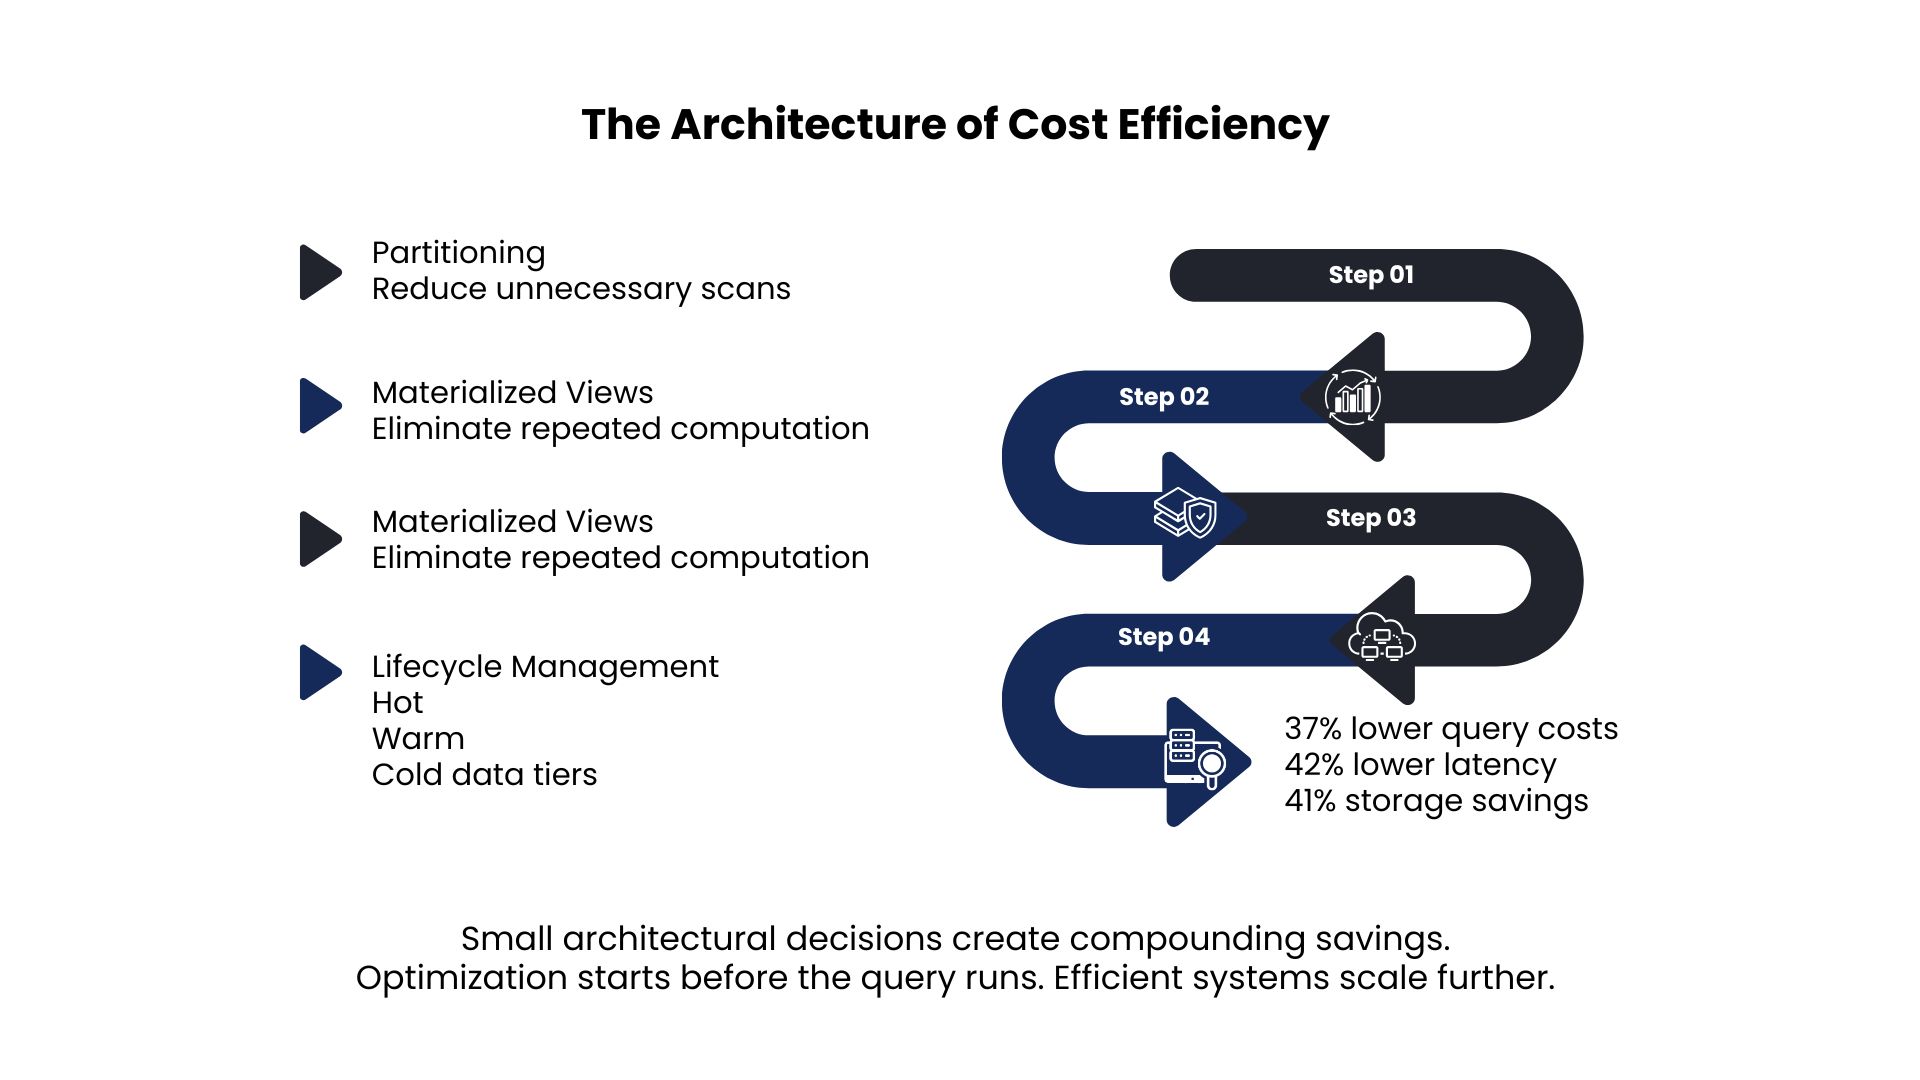
Tactical interventions produce short-term savings. Architectural decisions produce compounding returns.
Partitioning and clustering represent the highest-leverage structural investment. Partitioning organizes tables by date, region, or acquisition channel, forcing queries to skip irrelevant segments rather than scanning entire datasets. Clustering organizes data within partitions by frequently queried fields such as account ID, campaign ID, or ICP tier, aligning infrastructure with how the business actually asks questions. A 2025 benchmark showed that organizations that properly partitioned and clustered their GTM-critical tables reduced average query cost by 37% and query latency by 42% without changing underlying data volume.
Materialized views and caching address a different category of waste: repeated computation. A materialized view pre-computes complex aggregations such as multi-touch attribution models, customer lifetime value, or weekly conversion by campaign, storing results directly on disk. When a marketing manager loads a dashboard, the system reads the pre-calculated output rather than re-running heavy computation across millions of raw rows. The economic model resembles financial option pricing: a known upfront compute cost eliminates unpredictable recurring compute. For frequently accessed metrics, this arbitrage generates significant ROI within the first quarter.
Data lifecycle management is one of the most underused levers available. Not all data deserves premium accessibility indefinitely. A tiered retention model separates hot data for active analytics, warm data for occasional analysis, and cold data for compliance or historical model retraining. A 2024 RevOps case study found that moving data older than 36 months into archival storage reduced storage-related spend by 41% while keeping operational analytics fully responsive.
A Framework for Measuring and Managing Analytics Cost
The Data-Cost Efficiency Score (DCES) provides a structured way to assess maturity across four dimensions.
Compute-per-value maturity measures whether expensive compute is reserved for high-impact workloads. Storage-efficiency maturity measures whether redundant data is minimized and lifecycle policies are enforced. Governance maturity measures whether query patterns are tagged, budgets are set, and anomalies trigger alerts. Architecture-awareness maturity measures whether partitioning, clustering, and materialization decisions treat cost as a design constraint rather than an afterthought.
Organizations that reached a DCES of 4.0 or higher within 18 months reduced warehouse spend by 36% while maintaining or improving query performance. The score is a diagnostic tool for identifying where architecture or governance investment will generate the largest returns.
Governance as the Missing Layer
The hardest cost optimization problems are organizational, not technical. Even a well-architected warehouse accumulates waste when teams lack visibility into their consumption or incentives to change behavior.
Effective governance starts with attribution. Tagging queries and datasets by team, project, and business function transforms abstract infrastructure costs into specific line items. When a marketing analytics team sees their $14,000 monthly compute bill linked directly to specific dashboards and analysis workflows, optimization becomes self-directed rather than centrally mandated. A 2024 RevOps survey found that teams tagging workloads by GTM function reduced unexplained spending spikes by 52%.
Budget enforcement moves governance from observation to action. Compute quotas, auto-suspension when thresholds are exceeded, and alerting before overruns occur prevent reactive invoice surprises. Organizations that set storage and compute budgets and used auto-throttling during peak-cost periods saw cost growth slow by 29 to 34% without reducing GTM capability.
Cost ownership, however, cannot sit with data engineering alone. The most sustainable governance structures involve shared accountability: technology teams own architecture and tooling, business teams own workload patterns and dashboard usage, and finance owns ROI tracking. Organizations with joint data-cost review boards across marketing, RevOps, data, and finance reduced warehouse spend-to-revenue ratios by 27% over 18 months while maintaining analytics velocity.
Strategic Implications: Efficiency as a Competitive Advantage
The organizations that will lead analytics-driven marketing in the next decade are not necessarily those spending the most on infrastructure. They are those running it most efficiently.
Cost-efficient analytics compounds in the same way that technical debt compounds, only in reverse. Every dollar saved on unnecessary compute can be reinvested in better enrichment signals, more sophisticated models, and faster experimentation without increasing headcount or procurement complexity. As AI workloads expand, organizations with cost-aware infrastructure will scale their analytical capabilities while competitors absorb diminishing returns from unmanaged growth.
Three shifts define this transition. First, treating data warehousing as capability infrastructure rather than commodity utility. Second, embedding cost intelligence into the analytics workflow: query planning tools that estimate costs before execution, BI platforms that flag inefficient patterns, and data catalogs that surface high-frequency datasets worth materializing. Third, building adaptive systems that learn from usage and optimize automatically, where machine learning models predict query costs, recommend partitioning strategies, and suggest materialization candidates based on access patterns.
Conclusion: Cost Optimization as Architectural Discipline
Analytics costs escalate when organizations scale data usage without scaling governance. Uncontrolled queries, redundant storage, idle compute, and unclear cost ownership are symptoms of the same underlying problem: infrastructure designed for flexibility without design for financial sustainability.
The solution is to build systems that scale economically: partition and cluster data around how the business queries it, materialize high-frequency logic rather than recompute it, tier data by access frequency, and create governance structures where cost is visible and manageable before the invoice arrives.
In a world where every marketing decision runs through analytics infrastructure, the efficiency of that infrastructure determines the ceiling on strategic capability. Cost optimization is not a finance exercise. It is architectural discipline in service of long-term competitive advantage.